

Usage dashboard
About this dashboardThis dashboard is for customers on profile-based pricing. Usage is calculated based on unique customer profiles and reflects the metrics used for billing on current plans.
If your account is on event-based pricing, refer to the Event usage dashboard.
Usage dashboard benefits
- Proactive limit management: View contractual limits directly on graphs and progress bars to identify when you're approaching thresholds and take action before reaching them.
- Entitlement visibility: See all billing metrics in one place with clear contract-to-date (CTD) indicators for annual allowances and progress bars for metrics with maximum limits.
- Detailed breakdown analysis: Access monthly breakdowns for key usage-based metrics—such as mobile message orchestrations and API orchestrations—to understand which channels drive your consumption.
- Multi-level monitoring: View usage data at workspace or project levels to monitor consumption across your organization or drill into specific implementations.
- Easy data export: Download CSV files that match exactly what's shown in the charts and tables for your selected time range.
Access the usage dashboard
Go to Overview > Bloomreach usage. Switch between workspaces using the selector in the top right corner.
Permissions required
You need the following permissions to access the usage dashboard:
- Project-level dashboard: Project Admin or Project Usage Viewer role.
- Workspace-level dashboard: Workspace Admin or Workspace Usage Viewer role.
How the usage dashboard works
The dashboard collects your usage data daily and stores it permanently—including data that's later deleted or expired. Think of it as a snapshot album rather than a live camera—it captures what occurred and stores it permanently.
ImportantThe dashboard captures data before any deletions happen. Even if you've set events to expire after a certain time, the dashboard will still show those events in its historical record because it took the snapshot before they were removed.
Dashboard levels
- Workspace level: Aggregates usage across all projects within your workspace and compares data against the limits and allowances defined in your contract. Use this view to monitor overall consumption and manage contractual limits.
- Project level: Shows detailed metrics for individual projects, identifies which implementations drive consumption, and highlights optimization opportunities. This level shows no limits.
Contract period and current month
The dashboard header displays:
- Contract period: Your current contract term—for example, Sep 2025 – Aug 2026.
- Current month: The current calendar month, labeled as "MTD/partial" to indicate that values are month-to-date and that some data pipelines may still be processing.
- Last updated: A timestamp showing when the dashboard data was last refreshed.
You can also filter by workspace and project type using the dropdowns at the top of the page.
Dashboard sections
The dashboard organizes your consumption data into the following sections:
- Billing metrics: Contractual limits at a glance.
- Data storage and processing allowances: Allowances defined by your contract.
- Outgoing communications allowances: Annual allowance cards for communication-type meters.
- Contracted communication volumes: Per-channel contracted volumes (when applicable).
- Billing metrics breakdown: Detailed trend charts for billable profiles, monthly unique visitors, event storage, and profile updates.
- Outgoing communications breakdown: Stacked breakdown charts for all outgoing communication channels, mobile message orchestrations, and API orchestrations.
- Personalization metrics: Weblayers and experiments, in-app served, ad sends, and recommendations.
- Other metrics: Additional platform resource usage including catalogs, exports, prediction models, and more.
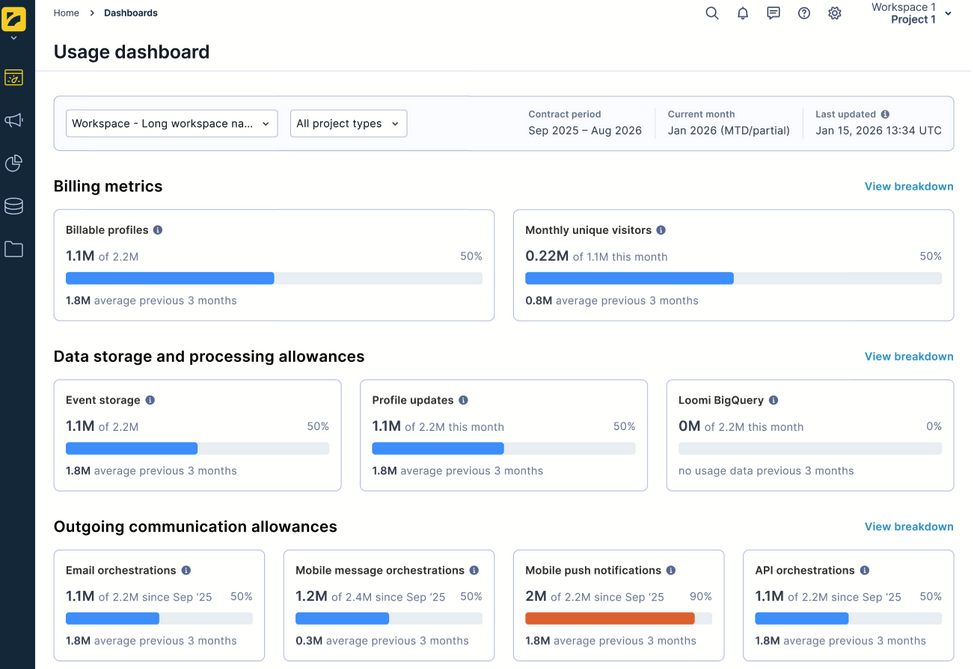
Billing metrics
At the top of the dashboard, this section displays all contractual metrics with clear entitlement indicators. Each metric card shows a progress bar with the current value versus your contracted limit and a percentage indicator—for example, "1.1M of 2.2M—50%".
NoteThroughout the dashboard, "3-month average" refers to the average of the last three fully completed months. The current partial month is not included in this calculation.
Billable profiles
The total number of customer profiles currently stored that count toward your contractual limit. Read more about Billable profiles.
Monthly unique visitors
The number of distinct visitors identified in your workspace during the current month, displayed against your monthly limit. Read more about MUV.
How unique visitor counting works
- When someone visits your site or app for the first time, they're counted as a unique visitor. Return visits from the same person—even across devices or after login—aren't counted again if Bloomreach can recognize them.
- If an anonymous visitor later gets identified and merges with an existing profile, the unique visitor count changes depending on which profile they’re matched to. If they’re matched to someone already counted as a unique visitor, they won’t be counted twice.
ImportantThe monthly unique visitor count in the usage dashboard will likely not match counts from other analytics tools. This is because of subtle differences in methodology and tracking.
Calculation: Unique visitors are aggregated daily. During the current month, the dashboard shows a rolling monthly value.
Data storage and processing allowances
This section covers metrics related to data storage and processing. Each card shows a progress bar with the current value versus the contractual limit, a percentage indicator, and the period type—either snapshot or monthly allowance.
- Event storage: The total number of events currently stored at the last dashboard update (snapshot cap).
- Profile updates: The number of times customer profile attributes are modified through imports, campaign scenarios, JavaScript SDK calls, or Data API requests. Each property change counts as one update (monthly allowance).
- Loomi BigQuery: The amount of data processed by BigQuery queries, measured in gigabytes per month (monthly allowance).
Outgoing communications allowances
This section displays annual allowance cards for all communication-type billing metrics. All metrics use a contract-to-date (CTD) period type. Each card shows:
- CTD progress bar: Usage since contract start—for example, "1.1M of 2.2M since Sep '25—50%."
- 3-full-month average: Average monthly consumption for the last three months, excluding the current month.
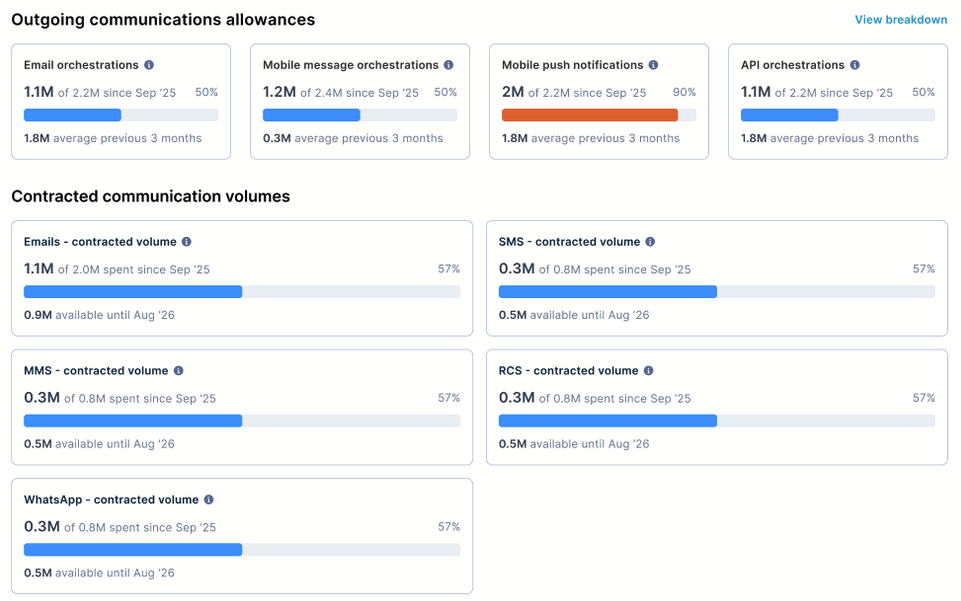
The following metrics appear in this section:
- Email orchestrations: Number of emails created, orchestrated, or assembled through Bloomreach, including transactional messages and messages delivered through Channel API.
- Mobile message orchestrations: Combined number of mobile messages—SMS, MMS, WhatsApp, and RCS—orchestrated through Bloomreach, including transactional messages and messages delivered through Channel API.
- Mobile push notifications: Number of mobile push notifications sent via Marketing, including App Inbox notifications.
- API orchestrations: Number of API orchestration calls — webhooks and managed endpoint calls — from and to Marketing.
Contracted communication volumes
When you've purchased individual communication types, the dashboard also shows per-channel contracted volumes for emails, SMS, MMS, WhatsApp, and RCS. Each card shows the amount spent since contract start, total contracted volume, percentage used, and remaining volume until contract end.
Billing metrics breakdown
This section provides trend charts covering the previous 12 full months plus the current partial month. Use the Previous 13 months time range selector and Download .csv button to export data.
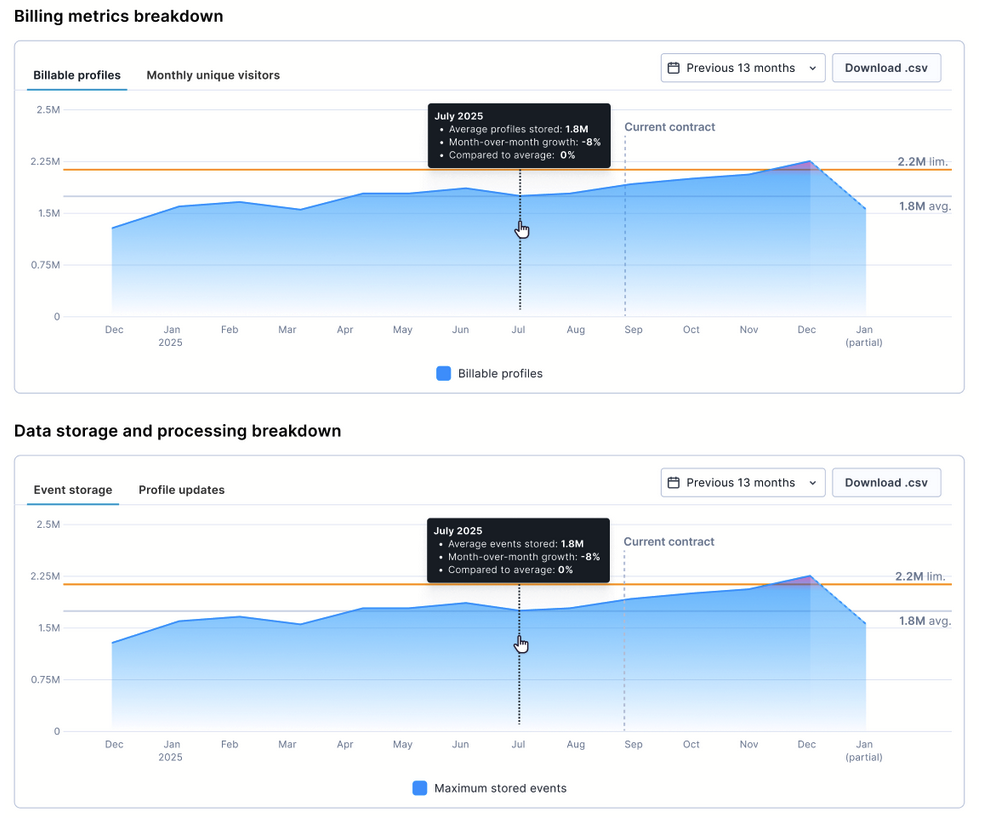
Billable profiles — monthly average
An area chart showing the average number of billable profiles stored over this period. The chart includes:
- Limit line: Your contractual billable profiles limit as a horizontal line.
- Average line: The average value across the displayed period.
- Current contract indicator: A visual marker showing the start of your current contract period.
- Tooltip: Hover over any month to see the average profiles stored, month-over-month growth, and comparison to average.
Event storage — monthly average
An area chart following the same structure as the billable profiles chart, showing the average number of events stored over the same period.
The section also includes tabs for monthly unique visitors and profile updates.
Outgoing communications breakdown
This section provides stacked bar charts and tables showing per-channel usage over time across 3 tab views. Use the Previous 13 months time range selector and Download .csv button to export the breakdown data.
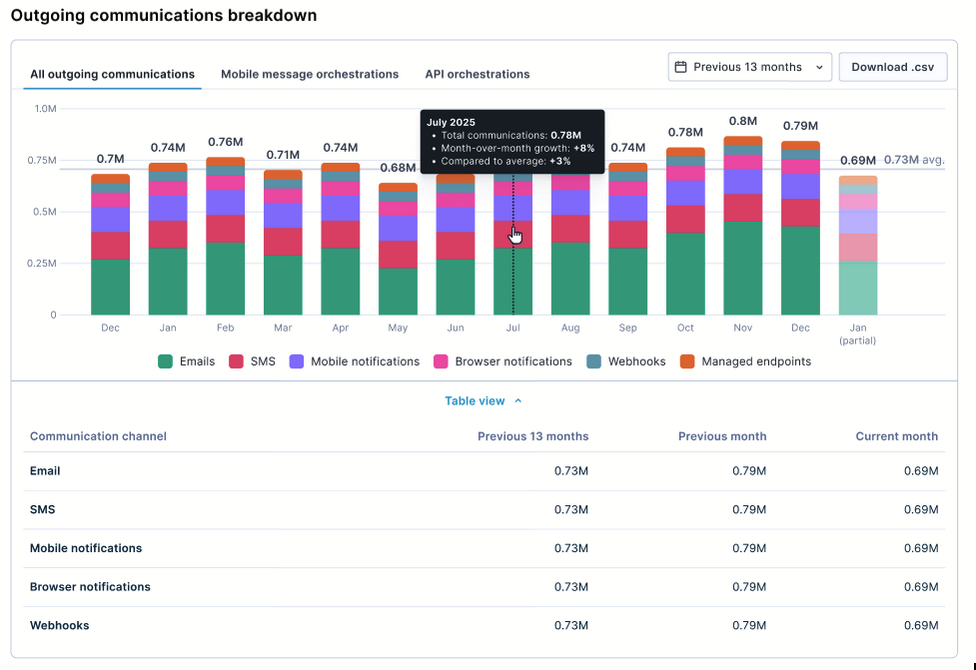
All outgoing communications
A stacked monthly bar chart showing all outgoing communication channels combined, color-coded by channel type: emails, SMS, mobile notifications, browser notifications, webhooks, and managed endpoints.
The table view below the chart breaks down each channel with columns for:
- Previous 13 months: Total volume over the displayed period.
- Previous month: Volume for the prior completed month.
- Current month: Volume for the current partial month.
Mobile message orchestrations
A dedicated tab showing mobile message orchestrations broken down by sub-channel—SMS, MMS, WhatsApp, and RCS—with a stacked monthly bar chart, an annual CTD indicator, and a table with rows for each channel and a total.
API orchestrations
A dedicated tab showing API orchestrations broken down into webhooks and managed endpoints, with the same stacked bar chart, CTD indicator, and table structure as the mobile message orchestrations tab.
ImportantCommunication data reflects real actions performed in Marketing and doesn't account for campaign event mapping in project settings. Data is based on campaign actions processed within the month and won't reflect event deletion or expiration.
Personalization metrics
This section tracks average monthly volumes for interactive customer experiences.
- Weblayers and experiments: Combined count of weblayers and experiments shown to visitors.
- In-app served: Number of in-app messages served from the system.
- Ad sends: Number of ad audience calls processed.
- Recommendations: Number of recommendation calls served, including requests without tracking serve events such as email previews.
Each card shows a 4-month trend mini-chart—for example, Oct, Nov, Dec, Jan—the 3-month average value, and a tooltip on hover showing the exact monthly value, month-over-month growth, and comparison to average.
Other metrics
This section covers average monthly usage for additional platform resources, with each card showing a 4-month trend mini-chart and the 3-month average:
- Catalogs: Number of catalog rows processed.
- Exports: Number of rows exported.
- Prediction models: Number of active prediction models.
- Imported events: Volume of imported events.
- Ad audiences: Ad audience events processed.
- TCPA list validation: TCPA list validation events processed.
- Omniconnect monthly requests: The number of inbound requests received by your Omniconnect integrations this month, shown against your workspace's monthly request allowance. The card shows the current month-to-date value and the last three completed months for comparison. See Omniconnect limits for the thresholds that apply to your plan.
Limitations
- Historical data availability: Metrics display from your workspace configuration date. Earlier historical data may not be available.
- Real-time updates: Metrics refresh on a schedule. Recent activity may take up to 24 hours at the project level or 48 hours at the workspace level to appear.
- Partial month values: The current month is always labeled "(MTD/partial)." Treat these values as provisional until the month closes.
- Export limitations: CSV exports include data for the selected time range and view level only. Generate separate exports for multiple projects.
Updated 3 days ago