

Clarity analytics
This article guides you on how to use Clarity evaluation dashboards in the Use Case Center.
What are Clarity dashboards
Clarity dashboards offer a standardized way to evaluate how Clarity performs across your store. Instead of piecing together reports manually, you get a pre-built suite of 4 dashboards that help you measure Clarity's real impact on revenue, conversion, and customer behavior.
Prerequisites
-
User permissions: Ensure you have the Reports Editor and Dashboard Editor roles.
-
Data mapping: Configure data mapping and confirm that the required events are tracked in your project. Work with your Bloomreach representative to map the following events under Data & Assets > Data manager > Mapping:
-
view_item -
view_category -
purchase -
purchase_item -
cart_update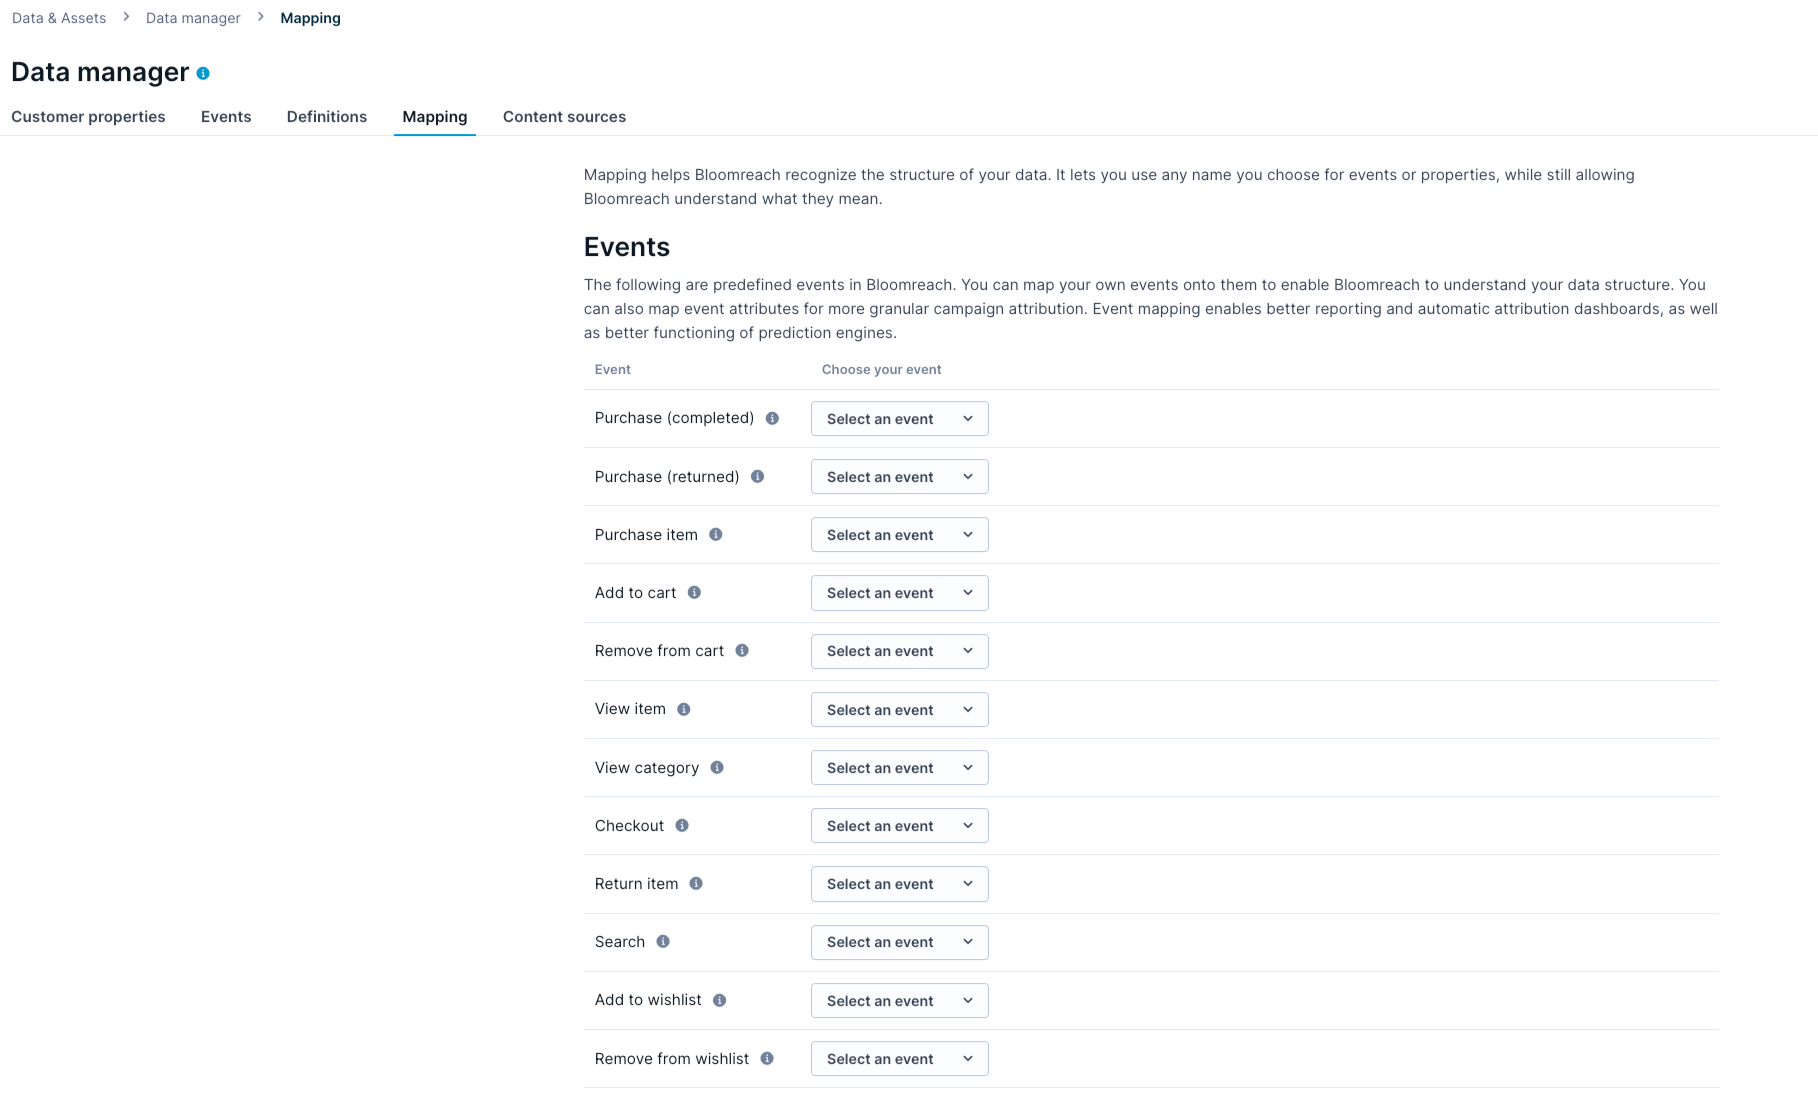
Configure data mapping
-
-
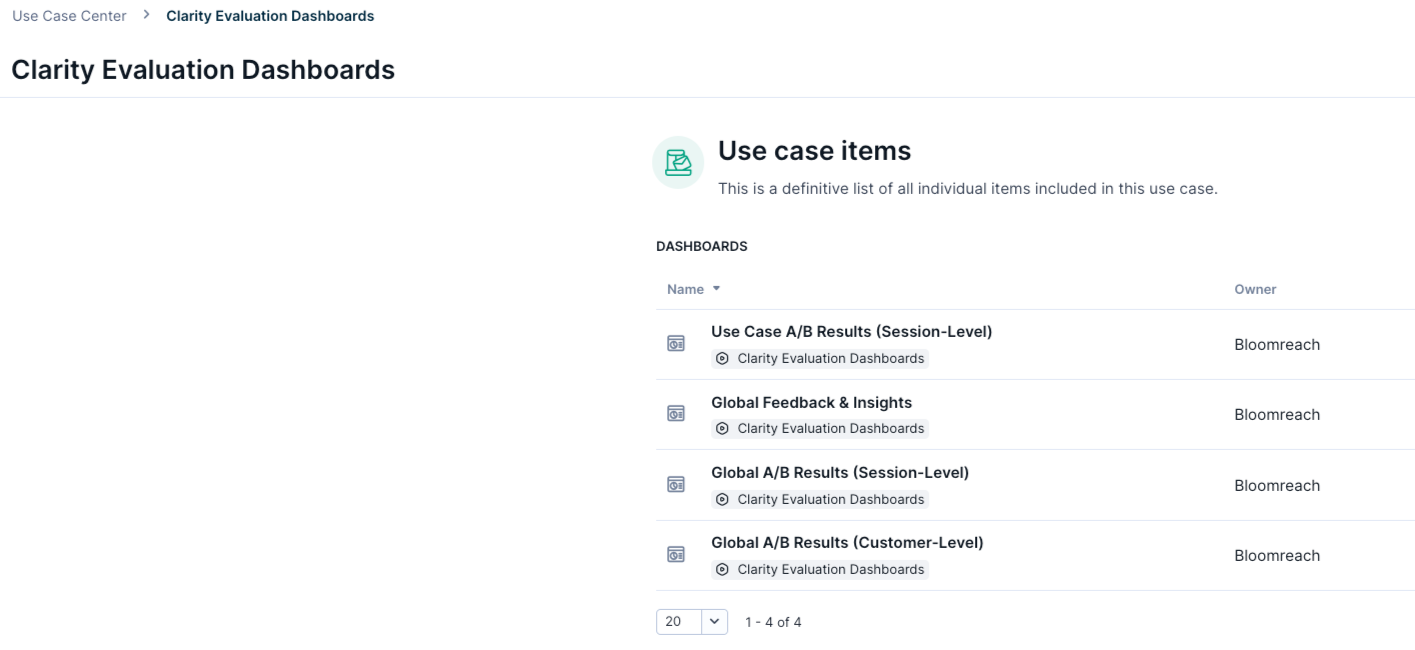
Access: To access evaluation dashboards, request your Bloomreach representative to enable them. Once enabled, the dashboards are visible under Use Case Center > Clarity Evaluation Dashboards.
View evaluation dashboards
-
Knowledge: Familiarity with concepts including metrics, segmentations, and running aggregates.
Dashboard types
The Clarity dashboard suite contains 4 dashboards. For a full list of metrics available across all dashboards, see Clarity dashboard metrics.
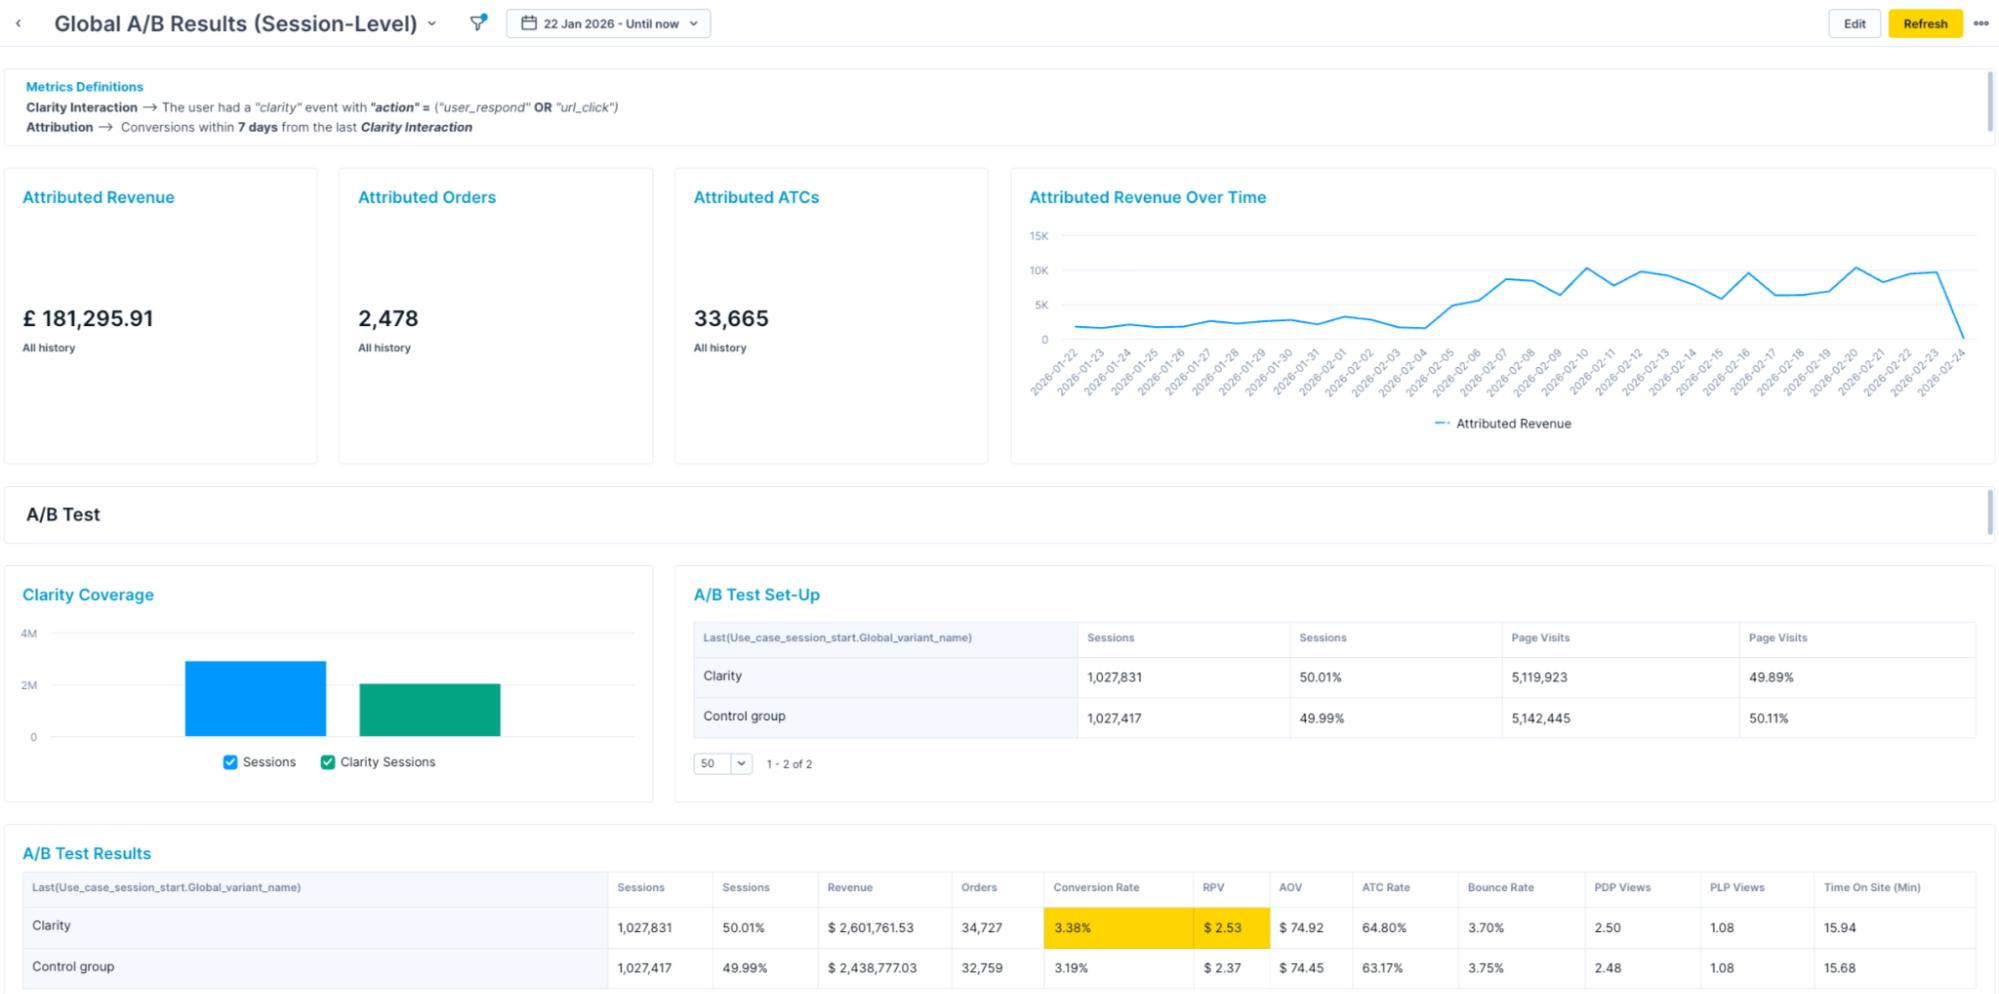
Global A/B results (session-level)
Business goal
Measure Clarity's overall revenue and conversion impact.
Description
NoteTo monitor the long‑term impact of Clarity, Bloomreach recommends maintaining a small global‑level holdout (around 5–10%) to continuously assess its performance over time. This holdout consists of traffic that never sees Clarity. Use this dashboard to track customer uplift in the Clarity variant compared to the Control group.
This is the primary dashboard for measuring Clarity's overall impact. It provides a session-level view of your global A/B test, comparing sessions where customers were exposed to Clarity against sessions in the control group, giving you direct insights into whether Clarity is driving more revenue and conversions.
This dashboard answers questions like:
- Is Clarity driving more revenue than the control group?
- How does the conversion rate compare between the Clarity and control group variants?
- Is Clarity performing differently on mobile versus desktop?
- How has attributed revenue trended over time?
Key metrics
Key metrics include A/B test results by device, attributed ATCs, attributed orders, attributed revenue, attributed revenue over time, average order value (AOV), bounce rate, Clarity coverage, conversion rate (CR), CR over time, PDP views per session, PLP views per session, revenue per visit (RPV), RPV over time.
Evaluate Clarity's overall impact
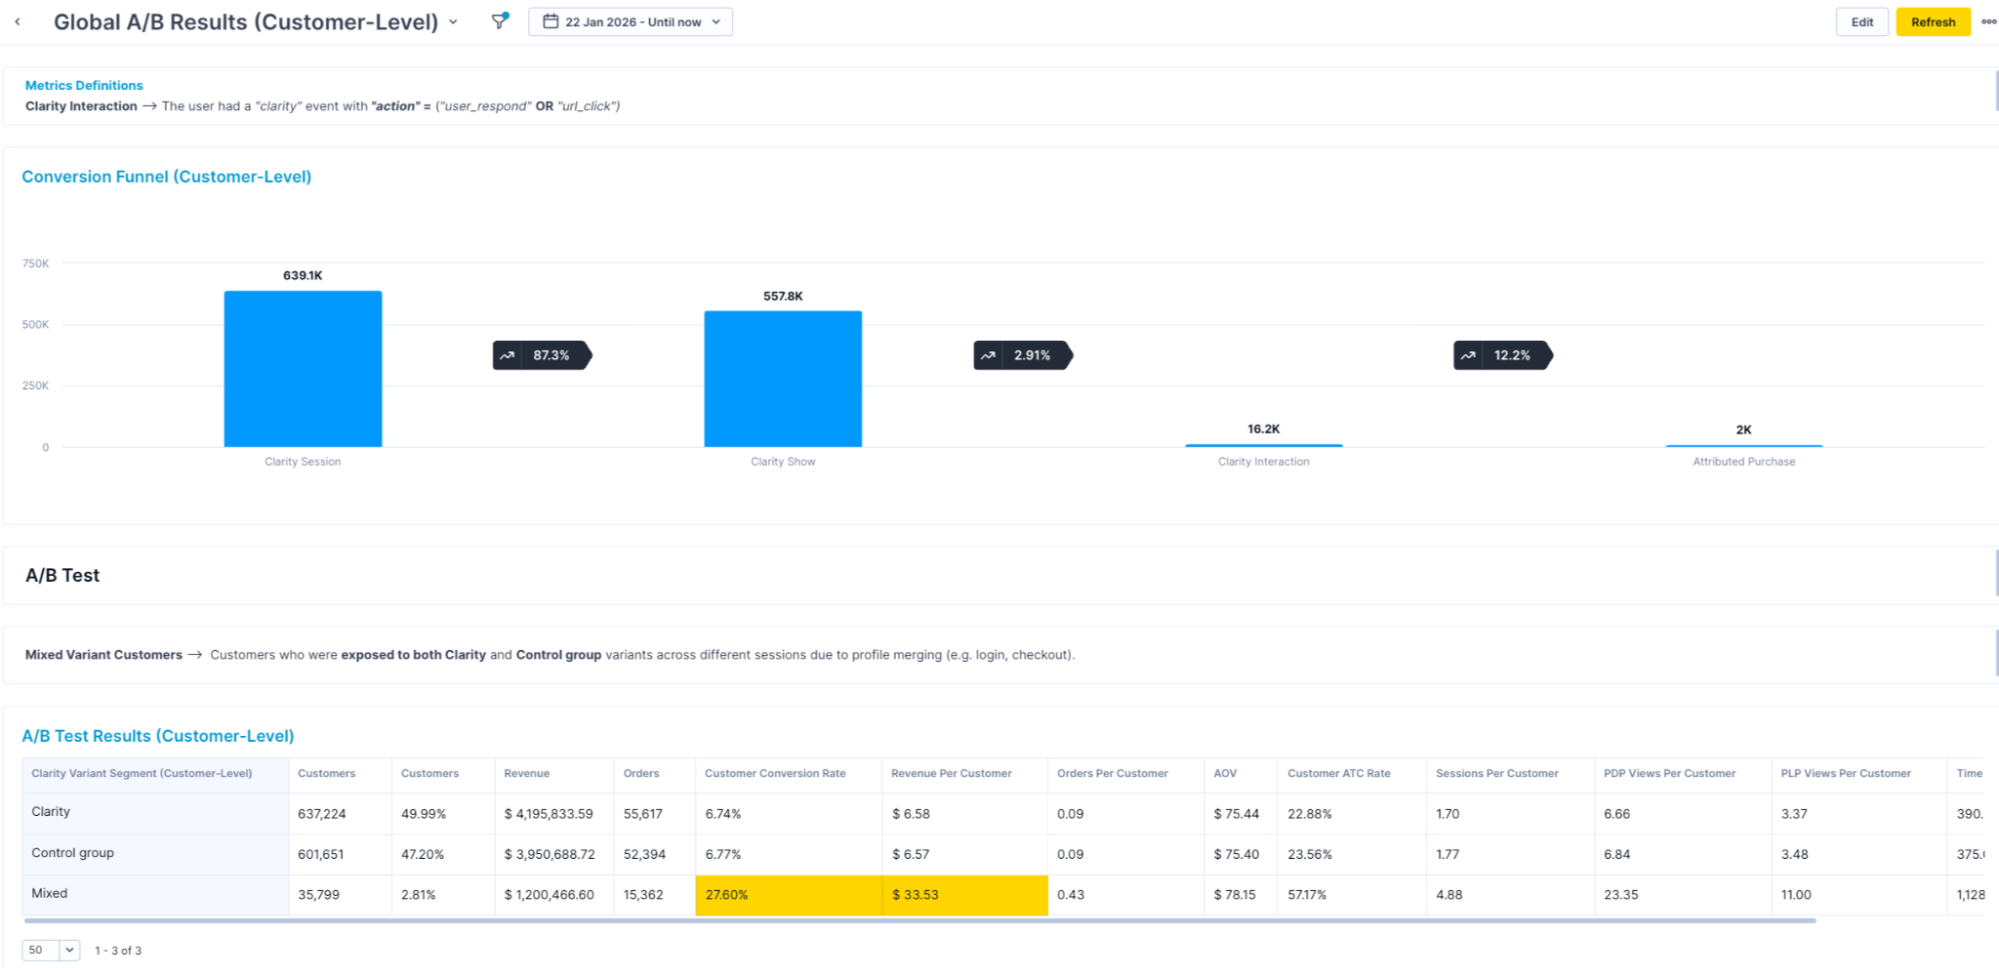
Global A/B results (customer-level)
Business goal
Understand how Clarity affects individual customer outcomes.
Description
This dashboard provides a customer-level view of the same global A/B test rather than a session lens. It counts unique customer profiles, illustrating how Clarity affects individual customers across their full journey through Clarity’s visibility and interaction, to an attributed purchase.
Use this dashboard to understand customer-level outcomes. This dashboard answers questions like:
-
What proportion of customers who saw Clarity went on to purchase?
-
Does Clarity perform better for new, returning, or loyal customers?
-
How many customers were exposed to both Clarity and the control group variants?
NoteSessions differ from customers: a session is a single website visit, while a customer profile merges all customer sessions into a single profile, including sessions from different devices and browsers.
Profiles identified as mixed customers are the merged sessions that were exposed to both the Clarity and Control group variants.
Key metrics
Key metrics include average order value (AOV), conversion funnel, customer conversion rate, drill-down by device, drill-down by loyalty, mixed variant customers, orders per customer, and revenue per customer.
Evaluate Clarity's impact on individual customer outcomes
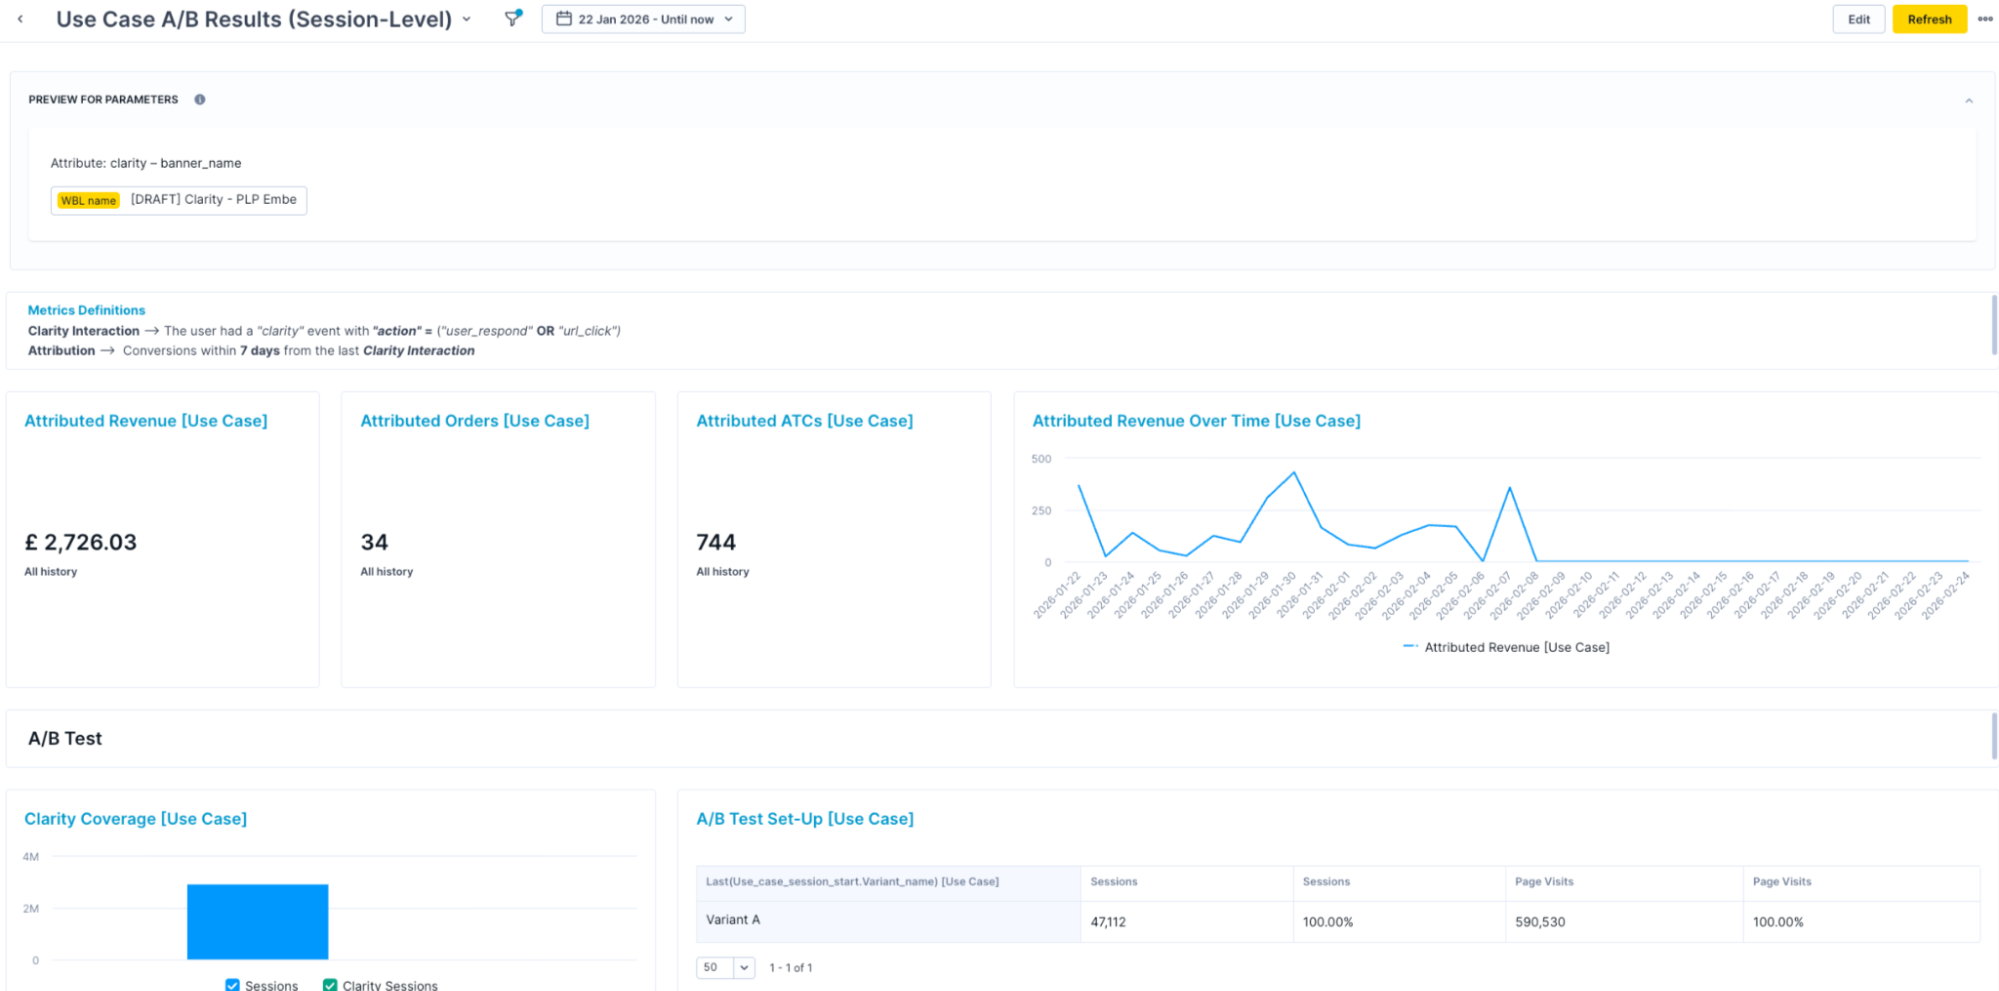
Use case A/B results (session-level)
Business goal
Evaluate the performance of a specific Clarity placement.
Description
This dashboard lets you filter the session-level A/B test results to a specific Clarity use case. It uses the same structure as the global session-level dashboard but scopes the analysis to sessions where that use case was active.
Use this dashboard to identify which placements are driving the most impact and which may need adjustment. This dashboard answers questions like:
- Is the PDP use case outperforming the PLP use case?
- Which use case is responsible for the conversion uplift seen globally?
- Should you prioritize one use case placement over another?
NoteFor overall (aggregated) impact across all Clarity use cases, always use the global session‑level dashboard as your single source of truth for metrics such as revenue uplift, conversion rate, and revenue per visit.
The use case dashboards (for example, PDP, PLP, Search) are not additive. A single session can trigger multiple use cases, so the same order or revenue can appear in more than one use case view. If you add up results across use cases, you will double‑count sessions, orders, and revenue. Use these dashboards to compare and optimize individual use cases, not to calculate the total impact.
Key metrics
Key metrics include A/B test results by device, attributed ATCs, attributed orders, attributed revenue, attributed revenue over time, average order value (AOV), bounce rate, Clarity coverage, conversion rate (CR), CR over time, PDP views per session, PLP views per session, revenue per visit (RPV), RPV over time.
Assess the use case-level impact
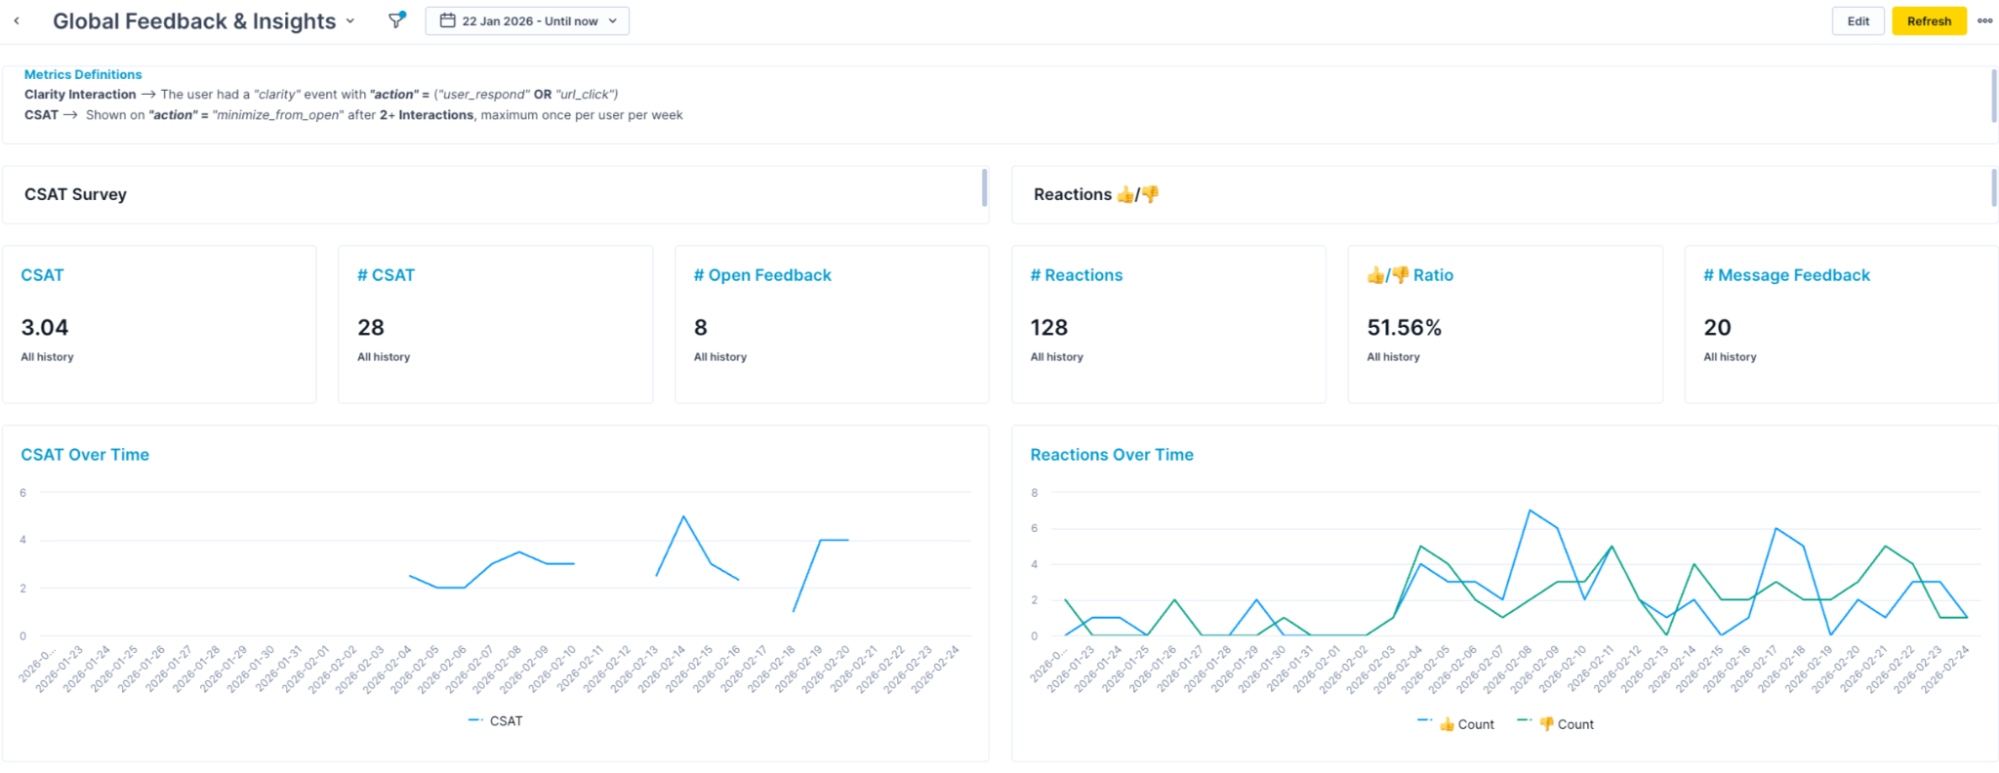
Global feedback and insights
Business goal
Understand customer satisfaction and interaction patterns.
Description
This dashboard captures qualitative and behavioral signals, that is, how customers feel about Clarity and how they interact with it. It tracks satisfaction scores, thumbs up/down reactions, conversation patterns, and commercially relevant signals like which product categories appear most in Clarity-attributed purchases.
Use this dashboard when you want to go beyond revenue numbers and understand the customer experience. This dashboard answers questions like:
- Are customers satisfied with Clarity's responses?
- Are customers clicking on products Clarity recommends, or mostly typing freeform questions?
NoteClarity collects customer feedback by default in two ways:
- Message reactions: Customers can react with a thumbs-up or thumbs-down on specific messages.
- Interaction rating: When customers close a chat, Clarity prompts them to rate the interaction on a scale of 1 to 5, with an option to provide open-ended feedback.
To disable feedback collection, contact your Bloomreach representative.
Key metrics
Key metrics include Clarity latency, CSAT, interactions over time, exit funnel, number of CSAT submissions, open feedback, thumbs-up/thumbs-down reactions, top actions and responses, top conversation starters, top revenue categories, top revenue products, user intent breakdown, and user response type.
View customer satisfaction and interaction patterns
Custom dashboards
Clarity offers 4 default dashboards that deliver a holistic view of its performance. Optionally, Bloomreach encourages you to learn more about analytics and create additional custom evaluation dashboards. Developing custom dashboards allows for:
- Tailoring analytics specifically to your needs and Clarity deployment.
- Diving deeper into the findings reported in the default dashboards.
- Performing more advanced analytical exploration.
Updated 4 months ago