

How to analyze transcripts with Insights
This guide introduces Insights and covers how to read the dashboard and filter down to specific conversations.
Prerequisites
Ensure you have the Conversational agent User permission to view transcripts and access Insights. This permission is necessary to access the Conversational agent application. Drilling into the metrics takes you to the transcript view.
What is Insights
The Conversational agent automatically analyzes every shopper conversation by sentiment, topic, and buying journey stage. The Insights dashboard shows you that analysis, built on the same conversation data covered in Transcripts. Every metric on Insights links back to that transcript view, so you can go from a trend straight to the actual conversations behind it.
Benefits
- Catch sentiment shifts early. Track positive, neutral, and negative conversation volume over time.
- See where shoppers are in their journey. View the awareness, consideration, evaluation, purchase, and post-purchase breakdown.
- Spot recurring themes. The topic breakdown shows what shoppers ask about most.
- Get answers about transcripts. Filter for a set of conversations, then ask the AI a direct question about them.
Read Insights dashboard
-
Go to Conversations > Insights.
-
Set the Agent and Date range at the top to scope the whole dashboard.
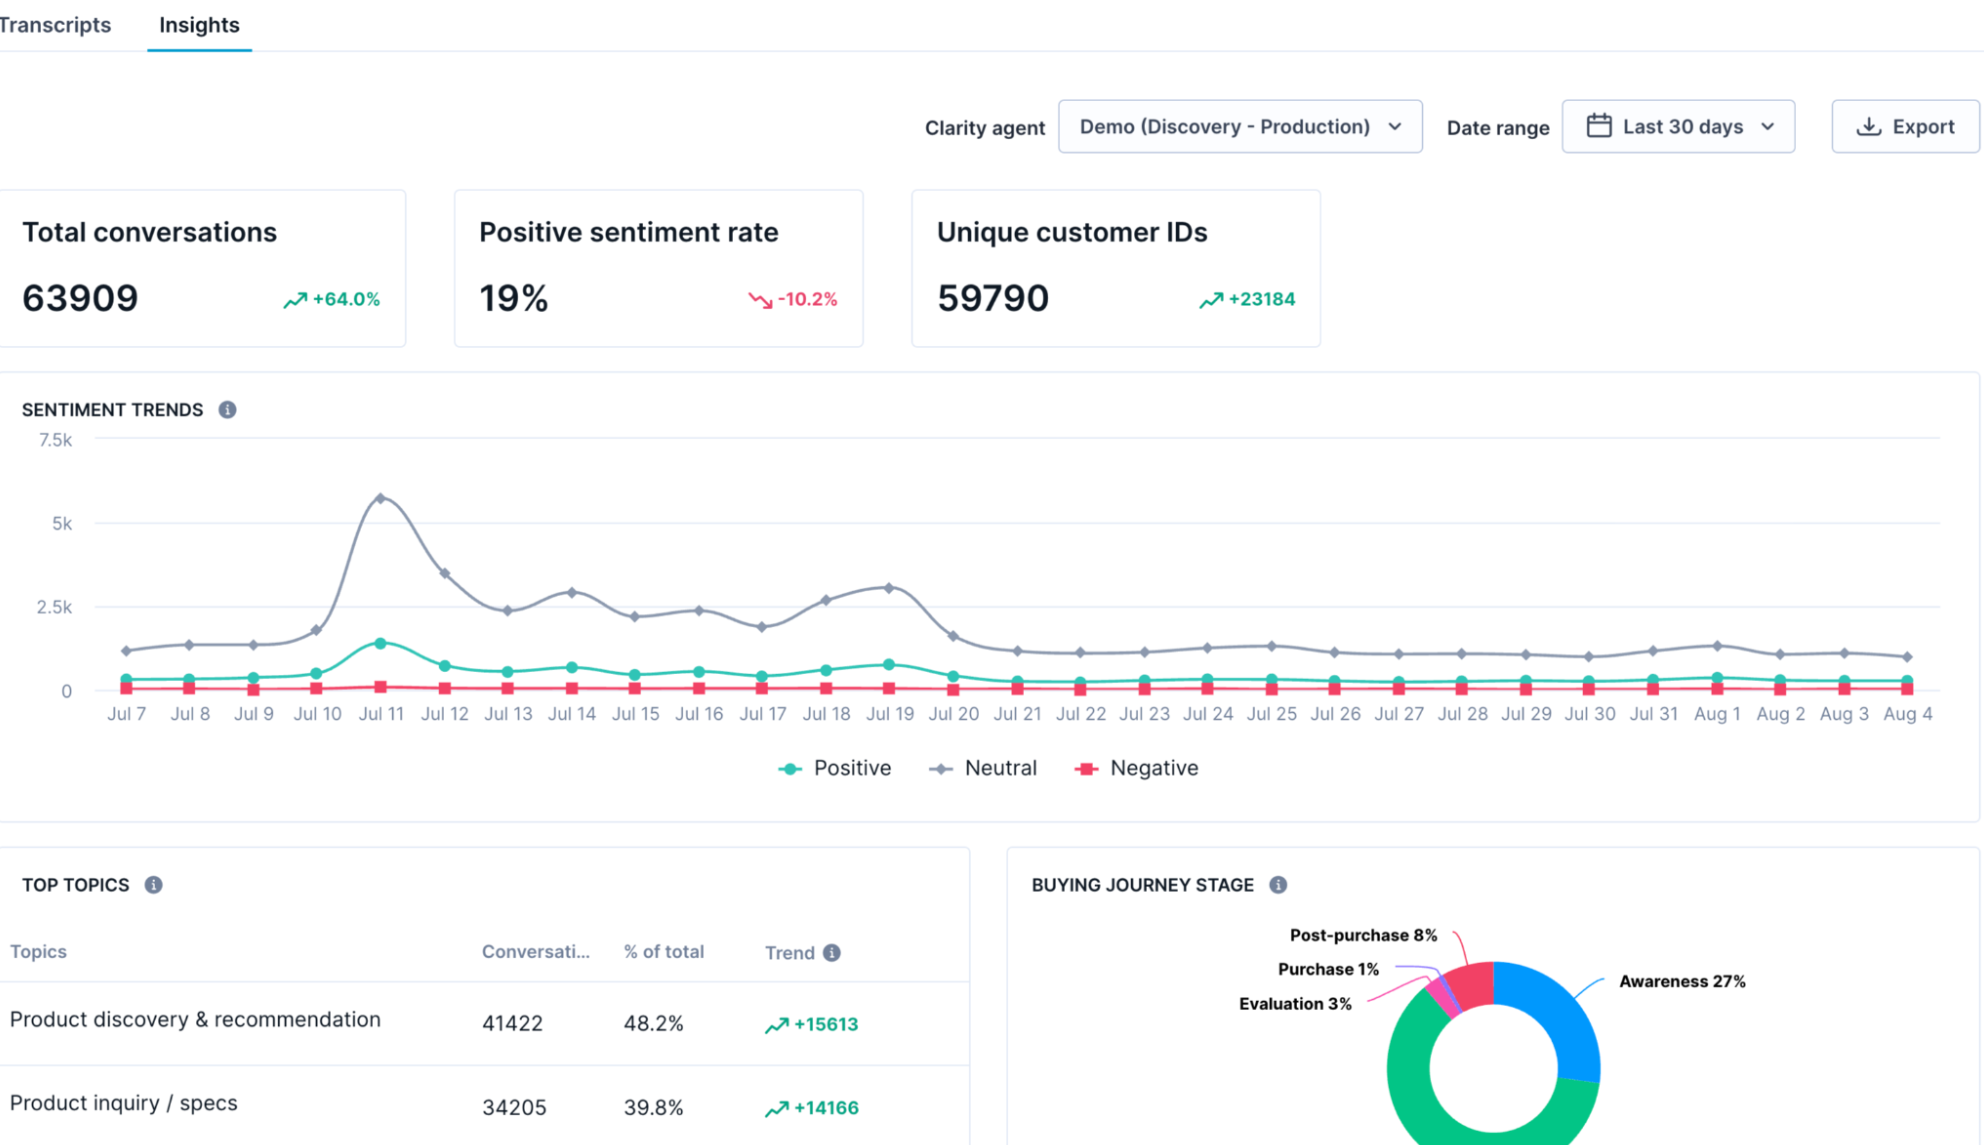
Scope the dashboard to see metrics.
- Review the summary metrics — total conversations, positive sentiment rate, and unique customer IDs — each compared to the previous period of equal length.
- Check the Sentiment trends chart for spikes or dips in positive, neutral, or negative volume.
- Check Top topics for a ranked breakdown of what shoppers are asking about, with trend versus the prior period.
- Check Buying journey stage for the awareness-to-post-purchase breakdown.
- Click Export to download the underlying data.
Add custom topics
Insights dashboard comes with a default set of topics, and you can also track topics or attributes specific to your business. For example, whether a shopper is buying for themselves or purchasing a gift.
Contact your Product engagement manager to set up a custom topic or a fully custom analysis mapped to your catalog or use cases.
Data refresh
Insights refreshes data automatically every 6 hours and analyzes conversations in 24-hour windows, so a conversation spanning multiple days appears as separate entries per day.
Trends calculation
The Date range you select sets the comparison window automatically. The last 7 days compare to the 7 days before, the last 30 days compare to the previous 30 days, and a custom range compares to an equal-length period immediately before it.
- Summary metrics (total conversations, positive sentiment rate, unique customer IDs) show the percentage change between the two periods.
- Top topics trend shows the change in conversation count for that topic between the two periods.
- Sentiment trends chart plots daily volume for the selected range only. It doesn't overlay the prior period, so use the summary metrics above it to see the period-over-period change.
Filter and drill into transcripts
- From the Insights dashboard, click any chart point, journey stage, or topic row to jump to the Transcripts with that filter already applied.
- On the Transcripts tab, refine further using Date range, Sentiment, Topic, Buying journey stage, or Customer filters.
- Combine filters to narrow to exactly the conversations you want, for example negative-sentiment conversations on a specific topic in the last 7 days.
Updated about 1 month ago